In the world of data and analytics, one of the most common errors we come across is the failure to declare the data grain in fact tables when beginning the design process. If the grain isn’t defined clearly, the whole project is at risk of collapse because you can quickly introduce errors into the design. The declaration of data grains also establishes what the table represents.
The data grain is declared before choosing the facts or dimensions. In this case, every fact or candidate dimension should be consistent with the grain. It should also maintain the right level of granularity when moving data around tables.
But before we get ahead of ourselves, let’s define it.
What Is Data Grain?
In data warehousing, granular data or the data grain in a fact table helps define the level of measurement of the data stored. It also determines which dimensions will be included to make up the grain.
These measurements of fact describe what you have populated in each row. For example, a grocery store can set up a fact table with each row representing a measuring scan or product. It’s a far better approach as it’s grounded in reality.
It’s much better than declaring that one row represents each Date, Product, and Store when naming dimensions. This matters because you might want to store a product at row level or store a grouping of products. So, in that sense, it determines whether it’s a product-level dimension or a group-level dimension.
However, this process isn’t straightforward. Sometimes, data volume, performance, and source systems may intervene when establishing grain volumes. It can also go completely wrong if your sales grain represents a day and your date dimension lowest grain is a week. In this scenario, your facts and dimensions are inconsistent.
As such, data warehouses are increasingly becoming more detailed with more refined grains because it provides more flexibility for analysis. For example, finer grains offer more flexibility in maintaining the sales values of individual customers instead of just storing their zip codes. Although it’ll demand more storage capacity, finer grains are more popular as storage costs are lower.
So, what’s the right level of granularity?
The “right” answer to the question is “it depends.”

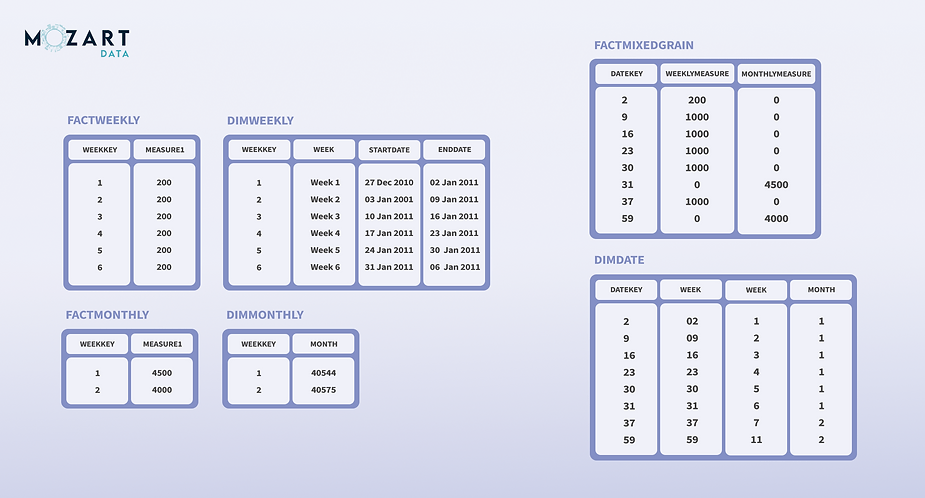
Sample: 2 fact tables vs. a mixed grain fact table
Determining the Right Level of Granularity
At the design stage, it’s important to identify and establish the granularity of each business process and each fact table. This means that you can locate the preliminary candidates for dimensions and measures in the fact table types.
Some characteristics of grain identification include
Specifying What Each Record Contains
Each grain you identify specifies precisely what’s inside the fact table record. The grain communicates the level of detail related to the fact table measurements.
In this case, you also choose the level of detail made available in the dimensional model. Whenever you add more information, the level of granularity will be lower. Whenever you add fewer details, the level of granularity is higher.
Classifying Each Level of Detail
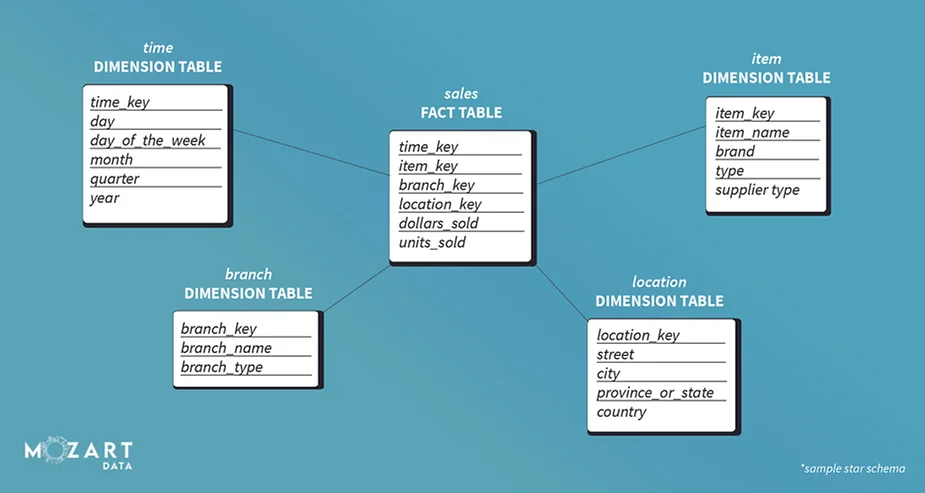
In a star schema, the level of detail included is called the grain. In this case, both fact and dimension tables have their own level of granularity. Both tables also include some level of detail that’s related to it.
In a dimensional model, the grain is the finest level of detail implied when you join fact and dimension tables. The granularity of a dimensional model, for example, includes the following dimensions:
-
Date
-
Store
-
Product

Detecting the Data
Whether it’s a fact or dimension table, each row will hold some data type. For example, this data can take the form of daily sales by Store, Product, and so on. Some standard grain definitions include a monthly snapshot of bank account statements, invoices, or a line item on a receipt.
Both fact and dimension tables have a granularity that is associated with them. Again, in dimensional modeling, it refers to the level of detail stored inside the table.
For example, you can have a dimension with a Date. These can also include Quarter and Year hierarchies. In this scenario, there’s granularity at the quarter level, but there’s a lack of information about individual Days, Weeks, or Months.
In contrast, a Date dimension table with Month, Quarter, and Year hierarchies will have granularity only at the Month level. It won’t contain any information at the day level.
You can manage different data grains by leveraging multiple fact tables like daily, weekly, and monthly tables. You also have the option of using a column that indicates the grain of the table or tables with a granularity flag. But it’s critical not to have data with different levels of granularities in the same fact table.
The best approach to identifying data grains for your objects is to ask yourself the following questions:
-
What’s the granularity of the fact table?
-
How do we handle multiple and separate grains?
-
Which type of fact table should we use?
-
What’s the atomicity (or level of detail) of our grains?
You can determine all high-level measures and dimensions based on the grain definitions. Once defined, generate a report of your data grain definitions.
The right level of grain detail is based on the findings of your business requirements. Documents such as bills and receipts usually contain information used to define the grain.
These documents also help determine the dimensions and measures for dimensional models. The grain you choose regulates the levels of details made available to the dimensional model. Furthermore, these grain definitions also form the foundation of each dimensional model and the available information.
Choosing the appropriate grain definition must take the following considerations into account:
-
Transactional Data: Look at documents with transactional data like order numbers and invoice numbers. Collecting documents like order forms and sales receipts is a good place to start.
-
Critical Business Elements: Take critical elements of the business into consideration. Information such as Customer and Product details are found at the lowest level and is often a requirement for businesses.
-
Date: The date is a vital point to consider as it helps us understand what level of detail is associated with a customer, product, or supplier.
You should review the level of detail in each grain to ensure that it’s at the most detailed level. At this juncture, it’s also important to anticipate the future needs of the business. This approach helps minimize the potential of a redesign at a later date.
It’s also essential to make this information available on a daily level. When you capture the appropriate level of granularity at the base of your transformation layer, it becomes a simple task to disaggregate summary reports to extract insight at a higher resolution
Data grains enable potential trade-offs between critical issues in data warehousing. These include the following:
-
Data performance versus the volume of data (which is directly related to the cost of storing that information)
-
Performance versus the ability to quickly access detailed data (and the costs related to accessing and storing large data volumes)
When you choose the appropriate level of granularity, it will significantly impact the volume of data stored in the data warehouse. It can also establish the capability of data warehouses to satisfy query requirements.
You can leverage tools like Tableau to calculate the level of detail expression. This approach enables the visualization of customer groups that share something in common. This can take the form of the first purchase made by a customer and the year of that first order.
In this case, you can quickly move data around tables, view sales and revenue data, break them down according to their groups, and more.
With Mozart Data, you can define your data grains to unleash your data team and unlock your full growth potential. Schedule a demo and see how we make access to data and analytics a breeze.

