Whether you like it or not, everything that happens inside, and sometimes outside, your business is being recorded or encoded. The good news is that with all of that data, you’ll never forget the things that have happened; but the challenge is to find a way to make sense of all that data. Figuring out how to process the raw data your business generates is a big task in and of itself, and that’s before you have to report to employers or investors about it.
This is why gathering data about your business and interpreting it correctly is so important. This can help you in improving the side of your business that needs to grow and to answer the many what-ifs that you may have as you go on with your business venture. That is why many ventures need data reporting.

What Is Data Reporting?
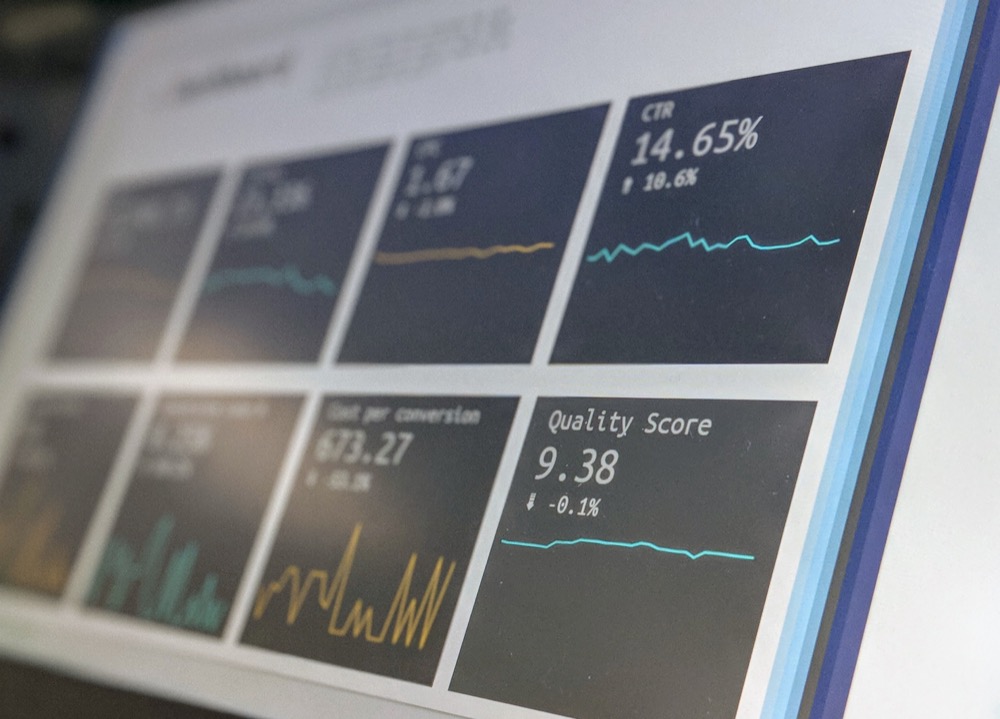
Data reporting is the process of collecting or gathering raw data, then interpreting it into a more sensible and understandable format for analysis. This can help you track what is happening and evaluate your growth. This is most often represented by charts, graphs, and tables that can easily be analyzed and quantified.
Importance of Data Reporting
Why should we use data reporting? Data reports can be used for an incredibly wide range of applications, like research, scientific improvements, business transactions, personal use (like tax records), electoral processes, and business growth. It enables accurate measurements and comparisons to other reports that may have been done in the past or present, and can be done more efficiently over time, so analysts do not have to spend unnecessary time performing it. It can give you the exact tools that you need for your convenience.
With good data reporting, visualization is more accurate and understandable. It can be created in the ideal choice of visual element, can be easily edited if needed, and lastly, it can make the decision-making process for an organization more efficient.
Types of Data Reporting Tools
There are several types of data reporting tools that you can use in order to make effective and presentable reporting for analysis. Before listing the big names in data reporting, it’s important to understand these different types of tools:
-
Self-made: these are tools that can help you make your own reports based on internal data or information.
-
Visualized reports: these are data that are represented by different visualization such as graphs, charts, and tables. It is used to make information presentable and easy to understand.
-
Business intelligence: these are tools that help you know the insights and possible actions that you need to take, and are typically represented by interactive and visual elements.
-
Software performance: this is used to know whether an application or software functions perfectly, how many people are using it, and how much money it can bring to your company.
-
Enterprise: this kind of data report tool is used for a higher level of security and reporting. This is usually represented by charts, graphs, and other information organizers.
-
Finance-related: these complex data reporting tools are used specifically for financial reports and analyzing different financial records and documents like payroll cash flow and balance and income sheets.
In order to maximize the function and use of these data reporting tools, you must identify and finalize your goal and know the strategies that you may use. This can help you build reliable data reports unique to your organization and identify the strengths, weaknesses, and changes you, your team, and your company are having.
Data Reporting Tools and Their Use
Here is a list of data reporting tools that you can use in making and constructing your company’s reports:
Google Analytics
As one of the most-used and free data reporting and analysis tools, Google Analytics collects and tracks data related to website traffic, including user behavior on site. You can also link other Google services with Google Analytics. The free version of Google Analytics can have a limit of 10 million hits per month, but if you want to upgrade, you can try Google Analytics 360 for more limitless hits and services.
One thing about Google Analytics that could be a disadvantage is that it cannot detect or include the information coming from non-Google products, but other information can be imported manually.
Zoho Analytics
Known in the industry as one of the easiest data reporting tools to use, Zoho Analytics can help you perform data reporting in just minutes of gathering information. It has an AI assistant you can ask for help in making your reports, even when more complicated questions need answers.
It is a convenient tool because of its connection in different cloud storages and database online, and it has unified analytics with other tools that make it easier to understand information. It also has pre-made templates of reports and dashboards with various visual elements that you may need in your data reporting.
Zoho Analytics has a free plan, but also has upgrade options.
Google Data Studio
Like Google Analytics, Google Data Studio is a free option. With its various visual elements to choose from, you can gather the data you need and connect it to various charts and dashboards to analyze.
Though easy to use, there are some limitations. It has no official support from Google and performs slower if you have 3 or more data resources in use, making it best suited only for small data analysis projects.
Microsoft Power BI
In need of easy-to-digest and reliable data reports? Microsoft Power BI is a potential fit. With over 100 data source connections, this data reporting tool excels in processing, making, and ingesting data for diverse reporting needs. Microsoft Power BI also has a wide range of options of interactive and custom visual representations. It also has a protective workspace and data security features for your gathered information. You can even make ad hoc and scheduled reporting or even flexible mobile and embedded reporting for your needs. Made to support multi-language programs and interfaces, this AI-based tool can do the model and data preparation for you.
Pre-made and personalized, this data reporting tool can be used in real-time reporting and data gathering, making it easy to use and reliable.
Xplenty
Offering its use and solutions for sales, support, and developers, Xplenty is a cloud-based platform that uses data integration which can help you in your analytics solutions and building marketing campaigns.
Providing the latest and accurate information and solution, this tool can even give you the data from your customer support and other relevant sources that could give you more insights for business decisions.
Xplenty can also do data integrations even in low-code or no-code choices.
Data Reporting vs Data Analysis
Many people think that data reporting and analysis are the same, but they are not. Here are some differences in reporting and analysis:
Purpose: reporting is for monitoring data and extracting it to make it easier to understand, while analysis is for deeper interpretation of information in providing recommendations for your next actions.
Work: reporting is for building, organizing, and consolidating data and turning it into graphs, charts, and other visualization, while analysis is examining, comparing, and confirming the data.
How Do You Create a Data Report?
There are a few important steps in creating a data report:
1. Collect Data: you must be able to gather and collect the information and data from all relevant sources that you may need for your specific reporting needs. Many data-reporting tools can manage to collect the data in a short matter of time, from minutes to hours.
2. Synchronize the data in a pipeline: now that you have collected your desired data, you can organize it with the use of a pipeline. Making a pipeline can help you see the progress of your business and know the strengths and weaknesses of your company.
3. Create visually effective reports: with all the data gathered and laid out in the pipeline, you can now make and build your report with the help of a business intelligence tool. With its wide choices of visual elements that you can use, you can make the best and most presentable data reports for you and your business.
How Mozart Streamlines Data Reporting
Mozart is one of the most reliable and effective options that businesses are using to collect and transform data, and it can be connected to business intelligence tools to make building accurate reports faster and easier, allowing teams to focus on other challenges. By using Mozart, you can stop worrying about the data and the reliability that it can give you.
Data reporting relies on the accuracy of the collected data, making the tools you use incredibly important. Contact us to try Mozart today.

